Jeanie Donovan, Amy Madore, Megan Randall & Kate Vickery
abstract | This report outlines best practices and challenges for Farmers Market Incentive Programs (FMIPs) and seeks to provide policymakers and practitioners with tools and information that will enable them to either launch new or scale up existing programming in their communities. FMIPs are programs which provide federal nutrition assistance beneficiaries a discount when they use their benefit dollars to purchase fresh fruits and vegetables at local farmers markets. The authors of this report conducted a survey of 10 established FMIPs across the United States – in Austin, Boston, Chicago, East Palo Alto, Los Angeles, Michigan, New York, Portland, Seattle, and Washington D. C. – analyzed indicators of program efficacy, and identified best practices and challenges in the following program areas: logistics, funding, technology, participation, outreach, and evaluation. The authors conclude that FMIPs can be effective tools for increasing the frequency with which low- income consumers access healthy, locally produced fruits and vegetables, and for helping to funnel consumer dollars into the hands of local agricultural producers. Moreover, the authors conclude that continuity in funding, strategic evaluation practices, tailored outreach efforts, and administrative and technical support through a central umbrella organization are critical components of programmatic success.
Food, nutrition, and agricultural policy have risen to the forefront of local, regional, and national discourse in recent years. Such discourse has been prompted by the rapid growth of the “food movement,” a diverse social movement encompassing a variety of perspectives on the way that food is produced, processed, distributed, and consumed in society (Pollan). Actors within the movement adopt differing views on the relationship between the food system and public health, the economy, the environment, and social equity, for example, as well as on ways in which the system can be reformed to better meet society’s evolving needs. Contemporary food policy initiatives must rise to the challenges posed by an increasingly diverse group of food system stakeholders and, where possible, integrate divergent perspectives to form more comprehensively beneficial policy solutions. This paper explores Farmers Market Incentive Programs (FMIPs) as one policy and programmatic innovation that lies at the nexus of two powerful sub-currents in the broader food movement: food security and local food.
Contemporary Food Policy
Food policy can be defined as the “laws, regulations, decisions, and actions by governments and other institutions that influence food production, distribution and consumption” (Wilde 1). Historically, United States food policy has played an influential role in shaping both the global and domestic food system through mechanisms as wide-ranging as agricultural subsidies and trade tariffs, food safety and labeling standards, and nutrition assistance programs. Today, domestic food policy initiatives and advocates seek to address an increasingly complex array of concerns such as the effects of agriculture on the environment and natural resource base, the recent rise of obesity and chronic disease, and persistent food insecurity for communities across the United States. Amongst stakeholders in the contemporary food movement, food security and local food advocates regularly participate in and shape the food policy discourse from the local to the federal level.
Anti-hunger and food security advocates are part of a long-standing movement whose main priorities have been to ensure that all individuals and households meet their basic caloric and nutritional needs and to promote social equity within the food system. Historically, its main policy levers for achieving these goals have been the maintenance of a robust social safety net in the form of federal nutrition assistance programs (such as the Supplemental Nutrition Assistance Program), support for federal commodity subsidies which have lowered the price of staple foods, and continued support for private charitable actors – such as food banks – which redistribute food resources throughout com- munities in order to provide emergency hunger relief and stabilize food access for populations in need.1
The anti-hunger movement, however, has traditionally been less concerned with the sourcing and production of food products, which constitute the main concerns of the “locavore” or “local food” movement. The local food movement perceives the expansion of local agricultural production to be the linchpin of a more economically and ecologically sustainable food system. Its main priorities are to reduce negative environmental externalities associated with centralized, industrial agricultural production and to invigorate local economies by funneling investment into community-based agricultural production and consumption.2 Some policy levers used to achieve these goals include the provision of federal grant funds for marketing and promotion of local and regional non-commodity producers (such as the Specialty Crop Block Grant program), as well as funding for Sustainable Agriculture Research and Education (SARE), and funding assistance for young farmers and ranchers (Congressional Research Service 24).
Tension between the food security and local food movements can surface when the local food movement is viewed as overlooking social equity – local food and its distribution channels being perceived as cost-prohibitive and inaccessible to food insecure populations3 – or when food security advocates are seen as neglecting to recognize the benefits that localized food production models can confer both to ecological systems and to human communities in the form of increased food quality and freshness. Diverse actors within the food system may find themselves competing for scarce funding as well as limited political capital available for food policy initiatives.
Opportunities exist, however, to bridge the gap and advance the priorities of each constituency. FMIPs present one such opportunity. Through such programs, federal nutrition assistance beneficiaries can significantly increase their consumer purchasing power when shopping at a local farmers market, thus enabling low-income consumers to buy a greater quantity of fresh, healthy food with their federal benefit dollars. Moreover, such programs channel additional consumer dollars into the local food economy and create value for local agricultural producers, thus addressing the dual objective of increasing food security while supporting local food production.
This paper explores FMIPS as one potential venue for policymakers and community leaders to meet diverse constituent goals by leveraging existing federal food security resources to expand access and advance more comprehensively just and sustainable community food systems. FMIPs are a young and growing program area (the oldest pro- gram surveyed for this paper was launched in 2004 in New York City), and only a handful of programs across the country receive public funding. Knowledge and research about program efficacy and potential as a policy tool is thus limited. Interest is growing, however, and this paper contributes to a preliminary body of inquiry and research into the value of such programming as a public policy tool, including a recent policy brief in support of “SNAP pricing incentives” from Johns Hopkins Center for a Livable Future, a positive status report on “healthy food incentives” at farmers markets from Whole- some Wave (a funder of infant FMIPs across the country), and a recent USDA “Healthy Incentive Program” pilot project which examined the use of SNAP incentives for the purchase of healthy food items in SNAP-authorized retail locations (Johns Hopkins Center for a Livable Future; Wholesome Wave; Bartlett et al.). This paper not only explores the utility of FMIPs as a public policy intervention, but also examines, in detail, operating practices and procedures from current programs across the country in order to outline best practices and challenges for policymakers looking to implement similar interventions in their communities.
Public Policy Research: The Best Practices Approach
Best practices research is a method for developing solutions to a problem based upon an evaluation of operational practices and policies commonly implemented by organizations, agencies, programs or other institutional entities responding to a similar challenge. The goal of such an evaluation is to delineate a set of generalizable theories and standards that are transferrable from the surveyed actors to other cases and contexts (Overman and Boyd 69). Social science researcher Arnošt Veselý explains that, as a method of policy analysis and program evaluation, best practices research is “
based on the idea that instead of formulating an abstract ideal state we want to reach, we should develop what has been or is being implemented and is proven to work somewhere else (Veselý 99).
Though commonly employed within the field of public policy, best practices research methods are less crystallized and less clearly defined than more traditional social science research methods. Veselý documents significant variation in the definition of best practices research proposed by scholars within the fields of management and public policy, and some public policy scholars propose different methodological principles for carrying out best practices research (some employ a quantitative approach, while others use more qualitative methods, for example) (Veselý 108-110). The term “best practice” can also be used interchangeably with the terms “smart practice” or “good practice.” Political scientist and public policy analyst Eugene Bardach dissects what he calls “smart practice research” in his Practical Guide for Policy Analysis: The Eightfold Path to More Effective Problem Solving and points out that learning about the tangible problem-solving behaviors of other actors can be a sensible and valuable exercise (Bardach Part III). He also notes, however, that this approach should be “supplemented by smart theorizing” and that steps should be taken to at least acknowledge, and ideally to avoid, common methodological pitfalls associated with best practices research, such as a reliance on limited anecdotal evidence (Bardach Part III).
This paper takes a best practices approach to the evaluation of FMIPs with the goal of delineating a set of common practices that are considered effective and beneficial by a diverse body of actors in this program area. This approach was selected for its ability to provide practical and concrete recommendations to practitioners for effective policy and program implementation. Moreover, in the context of a young and growing program area, for which very little data or prior research exist, creating a compendium of practices and knowledge from current actors in the field is one first step towards formulating additional research questions and conducting more rigorous analyses. The methodology employed by the research team is subject to the same weaknesses as is much best practices work, such as a reliance on a limited number of empirical observations and anecdotes from a small survey population. Moreover, a “best practice” in this context does not denote a definitively superior practice as compared to the scope of infinite tried and untried alternatives (since no such exhaustive comparison has been undertaken), but merely a practice which reflects some of the most beneficial operational and problem-solving behaviors identified, and currently employed, by a limited number of surveyed actors in the field today. This report outlines these best practices and challenges for FMIPs and seeks to provide policymakers and practitioners with tools and information that will enable them to either launch new or scale up existing programming in their own communities.
Background and Terminology
FMIPs provide federal nutrition assistance beneficiaries a discount when they use their benefit dollars to purchase fresh fruits and vegetables at local farmers markets. The discount is typically provided in the form of matching funds supplied to beneficiaries who choose to spend a certain number of benefit dollars at the market. The disproportionate incidence of preventable, diet-related disease in low-income and food insecure populations is often attributed to inadequate access to healthy food (Johns Hopkins Center for a Livable Future). FMIPs that lower affordability barriers and increase access can thus act as both a powerful public health intervention and a viable strategy for community and economic development.4
Food Security And Affordability
The United States Department of Agriculture (USDA) defines food security as
access by all people at all times to enough food for an active, healthy life (USDA Economic Research Service).
In 2011, an estimated 14.9% of U. S. households (17.9 million) experienced food insecurity at some point during the year (Coleman-Jensen et al. v). Food insecure adults and children are more likely to suffer from preventable, diet-related disease than those who are food secure. Food insecure adults consume fewer servings of fruits, vegetables, dairy, and complex micronutrients, and are more likely to experience risk factors for cardiovascular disease, such as hypertension, as well as higher rates of diabetes (Seligman 304– 307). Moreover, food insecurity has been linked to higher rates of obesity in children and women, with especially heightened risk for non-white populations (Seligman 305; Adams et al. 1070).
Affordability is one key barrier to healthy food access. The real price of fruits and vegetables rose 17% between 1997 and 2003, while the real price of a two-liter bottle of Coca-Cola fell almost 35% percent, suggesting that barriers to affordable healthy food are increasing (Cawley 364). Moreover, in 2012, a farmers market survey conducted in Austin, Texas and surrounding cities revealed that over half of market customers considered farmers market produce to be more expensive than produce purchased at their local grocery store (Morse et al. 12). The perceived and actual affordability of fresh fruits and vegetables, especially locally produced items from farmers markets, presents itself as a real barrier to access for many households (Parker-Pope). FMIPs address the affordability component of access by enabling low-income consumers to stretch the value of their food dollar when purchasing fresh, local food items.
Federal Nutrition Assistance Programs
The federal government administers several programs designed to alleviate food insecurity for low-income populations. FMIPs typically accept matching funds from at least one of three federal nutrition assistance programs: the Supplemental Nutrition Assistance Program (SNAP), the Supplemental Nutrition Program for Women, Infants, and Children (WIC), and the Farmers Market Nutrition Program (FMNP). SNAP is the largest and most well-funded of U. S. nutrition assistance programs. In the 2012 fiscal year, the federal government spent $81 billion on SNAP to help feed 47 million low-income Americans (Center on Budget and Policy Priorities). Benefits are redeemed through an Electronic Benefit Transfer (EBT) card which recipients can use at USDA-authorized SNAP retailers, including some farmers markets. SNAP has proven to be an effective tool for alleviating food insecurity and increasing access for low-income populations (Nord and Golla 15). A 2010 study from the Urban Institute found that receiving SNAP reduced an individual’s risk of food insecurity by 30% (Ratcliffe and McKernan 14).
Local Food
The United States has seen a surge in demand for locally produced food in recent years. The number of farmers markets in the U.S. increased from less than 2,000 in 1994 to over 7,500 in 2012 (USDA Agricultural Marketing Services). While local foods are available at an increasingly wide variety of retail establishments, farmers markets are a key indicator of the growth of the local food market. The appeal of local food is multi-faceted, and the consumption of locally produced agricultural products can confer a variety of environmental, economic, and social benefits to regions, cities, and communities.
A number of reports, for example, indicate that food produced within a smaller geographic radius travels fewer miles from farm to table than food imported from more centralized, remote agricultural operations, and thus consumes less energy and is more ecologically sustainable.1 More recent food system sustainability analyses, such as the work of Christopher L. Weber and H. Scott Matthew, have critiqued “food miles” as an oversimplified indicator of sustainability. However, the energy expended to support conventional food distribution remains significant (especially with automobile and air transport) and “food miles” remains one valid indicator of food system sustainability, especially when paired with other more sophisticated food transport indicators (Martinez et al. 48–49; Smith et al. 95).
Economically, purchasing locally produced goods, including food, generates additional income for local employees and businesses, and increases local consumption above and beyond the initial purchase. The rise in income and wave of subsequent spending generated by an initial act of consumption is called the economic “multiplier effect.” A recently released economic impact analysis of the local food sector in Austin, for example, estimated Austin’s local food multiplier effect to be 1.86 – meaning that every dollar spent within the local food sector in the Austin area generates 86 cents of additional economic activity (TXP, Inc.). The analysis, moreover, asserts that local foods have a larger multiplier effect than foods imported from outside the region, since purchasing local foods keeps dollars in the local economy longer. Research has confirmed that expanding local food systems can result in increased employment and income for the community (Martinez et al. 43–45).
The local food movement is also a social movement that seeks to rekindle the relationship between producers and consumers in the marketplace, to create spaces for community development, and to inspire a more healthful lifestyle and diet by enhancing consumers’ emotional connection to their food source.1 Empirical evidence demonstrates, for example, that young adults with positive attitudes towards local foods tend to have healthier eating habits, and that farmers markets can be gathering places for communities to form cohesive identities around issues ranging from ecological sustainability to social justice (Pelletier et al. 129; Alkon 271).
Nutrition Assistance and Local Food
The relationship between nutrition assistance programming and local food has fluctuated over the last several decades, in large part due to major reforms to the SNAP program in the 1990s and the resultant impacts on SNAP spending at farmers markets. Specifically, the transition from paper benefits to EBT in the early 1990s, while resulting in important improvements for the SNAP program and its recipients overall, had a large detrimental effect on SNAP spending at markets (Mercier 3-4). Between 1994 and 2007, SNAP redemption at farmers markets fell by 71% (Briggs et al. iv). This is largely attributable to the difficulty and expense of equipping farmers markets with EBT terminals (Mercier 4).
Moreover, research shows that SNAP recipients are often unaware of opportunities to use their benefits at markets, and may perceive markets to be culturally inaccessible, inconvenient to access, or more expensive than conventional retailers (Briggs et al. 14–15). Despite these barriers, SNAP redemption at markets has increased in recent years with the advent of public and private grant funding to equip markets with EBT terminals (Mercier 4, 25).
There are many potential benefits associated with increasing access to local foods for food insecure populations, including enhanced food security as well as a heightened sense of ownership and engagement in a more community-based food system (sometimes called “community food sovereignty”) (WhyHunger). Moreover, the local food economy may benefit from the influx of federal SNAP dollars. SNAP has a multiplier effect of 1.79, meaning that every SNAP dollar spent generates an additional 79 cents in economic activity (Hanson 16). Increased redemption of SNAP dollars at farmers markets and other local food retailers, incentivized through FMIPs, could therefore have a powerful impact on the local agricultural economy.
Methods
In order to identify FMIP best practices and challenges, the authors administered a 51-question survey to 10 FMIPs across the United States (between the months of February and March, 2013). Programs were selected based upon a loose set of criteria, with the hopes of achieving the following qualities amongst the study group: diversity in city size, geography, length of program operation, and funding model (making sure to include programs that receive significant public financial support). The authors surveyed the following 10 programs: the Austin Double Dollar Incentive Program (DDIP), Boston Bounty Bucks, Chicago LINK Up, DC Columbia Heights Festibucks, East Palo Alto Fresh Checks, Los Angeles Market Match, Michigan Double Up Food Bucks (DUFB), New York City (NYC) Health Bucks, Portland Fresh Exchange, and Seattle Fresh Bucks.
The authors contacted senior program representatives (such as managers and program directors) and collected either full or partial survey responses for all 10 of the selected FMIPs. The majority of survey respondents completed an electronic survey which contained both open- and closed-ended questions regarding the program and its characteristics. The research team contacted many of the program representatives via phone and collected remaining survey responses during one or several follow-up phone interviews. Clarifying comments were solicited from survey respondents and collected during e-mail or phone discussion.
Best practices and challenges were identified through a collaborative review process during which the research team exercised judgment to isolate recurring themes and issues of importance. Many programs (though not all) provided quantitative data on benefit redemption, clients served, and program growth over time. The authors compared and analyzed patterns in these data to arrive at a preliminary evaluation of programmatic success. It should be noted that this evaluation and review process was conducted in a qualitative manner, consistent with the standard applied to much best practices policy and program research. The authors did not perform rigorous statistical or causal evaluations, and present their findings only as a discerning summary of current and best practices, as well as challenges, communicated by a small but diverse sample of FMIPs. Information and data presented here should be viewed as a tool kit and qualitative resource for those who wish to learn more about FMIP models across the United States. More rigorous causal evaluations of program efficacy are beyond the scope of this report.
Findings
Given the data and responses provided by the 10 surveyed FMIPs, the authors present the following overarching key findings: 1) FMIPs are helping to increase the frequency with which low-income customers shop at farmers markets; 2) FMIPS are enhancing economic stability and sustainability of the markets and vendors that accept the incentive; and 3) continuity in funding, strategic evaluation practices, tailored outreach efforts, and administrative and technical support through a central umbrella organization are critical components of programmatic success. In addition, the research team has identified specific best practices and challenges for the following key program areas: logistics, funding, technology, participation, outreach, and evaluation.
Logistics
Survey participants responded to questions regarding program start-up, operating models, growth and expansion, operations, the incentive, vendor reimbursement, and staffing. Table 1 offers a summary of operations details.

Logistics Best Practices
- Growing the FMIP organically – starting small and establishing a funding and client base before expanding to additional market locations
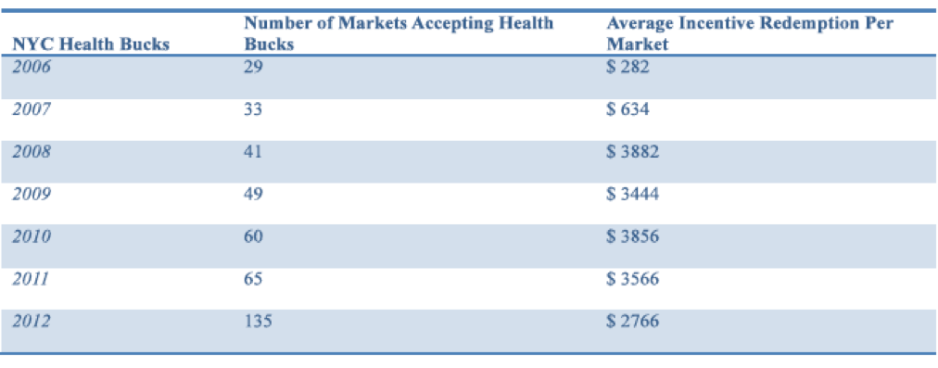
Each of the 10 surveyed FMIPs started small and grew organically, typically starting at just one or a handful of market locations before gradually expanding to additional markets as demand and resources increased. For example, NYC Health Bucks was originally established at just three select market locations as part of a collaborative effort between the NYC Department of Health and Mental Hygiene (DOHMH), neighborhood community organizations, and district public health offices. Due to its popularity and success, the program has since expanded to 135 markets across the city. Similarly, Michigan DUFB, administered by the Fair Food Network (FFN) and Michigan Farmers Market Association (MIFMA), started at five market locations in 2009 and, by 2012, operated at 75 markets across the state, serving nearly 90,000 SNAP customers.
- Establishing an umbrella organization to handle fundraising and administration of the FMIP – especially for programs which serve large geo- graphic areas and which can support more than 3 to 5 markets
Several operating models are available to FMIPs. Many of the programs surveyed, for example, employ an umbrella organization model in which one organization oversees FMIP administration and operations, but does not operate the farmers market itself and may only be minimally involved in day-to-day FMIP administration at the market-level. These umbrella organizations, such as FFN and the Boston Collaborative for Food and Fitness (BCFF), raise and distribute funding, provide technical and administrative support, and collect program data, but do not operate farmers markets.
Smaller programs, on the other hand, are often both administered and operated by farmers market organizations themselves, such as the Portland Farmers Market Fresh Exchange program and the Columbia Heights Farmers Market Festibucks pro- gram. These organizations incorporate the administrative costs of the FMIP into their existing operating budget and raise additional funds to cover the dollar value of the incentive provided to clients. In a third hybrid model, an umbrella organization ad- ministers the FMIP at various participating markets by providing funding and technical support but also operates the FMIP at its own farmers markets.
As seen in cities like Chicago, Boston, and NYC, FMIPs have successfully scaled up to serve multiple markets when the program is operated by a third-party organization. When such an umbrella organization operates the FMIP, market managers are relieved of the burdens of fundraising, tracking, and reporting and can focus their efforts solely on running the markets. Umbrella organizations are also able to act as an efficient single point of con- tact for assisting markets in becoming equipped with EBT infrastructure. Moreover, having a centralized program administrator enables greater uniformity, consistency, and scalability across a larger geographic area.
- Dedicating FMIP staff to assisting individual markets through site visits and relationship building
Umbrella organizations, such as FFN and BCFF, have between one and four full-time program staff to administer and support the FMIP. It is important for umbrella organizations to actively communicate with participating markets. Having a staff person available to perform site-visits and maintain regular contact with individual market managers is an important step towards meeting the unique needs of both markets and clients.
- Offering additional services and activities appropriate to customers’ needs and interests
Many of the markets that participate in an FMIP offer complementary services and activities for customers in addition to the incentive program. For example, seven of the surveyed programs offer cooking demonstrations at participating markets. Others offer market tours and master gardener classes. The Boston Bounty Bucks program partners with the Boston Cyclist Union to provide free bike tune-ups at participating markets. The FMIPs in Chicago, East Palo Alto, and Los Angeles partner with local administrative agencies and/or food banks to provide nutrition assistance outreach and enrollment services at the markets. Additional activities and services at the market are viewed as a way to increase customer participation and satisfaction.
- Allowing established farmers markets to join the program as FMIP demand and financial support grow
All surveyed FMIPs administered by a central umbrella organization have seen growth in the number of markets served each year. Program staff members report that new markets often approach them with interest in participating in the FMIP.
In order to determine if a market will be a viable partner, the umbrella organization often verifies whether the market has sufficient staff, existing capabilities to accept EBT, established market infrastructure, and outreach capacity to support the FMIP in addition to operating the market.
Logistics Challenges
- Absorbing the costs and labor associated with operating an FMIP into existing market capacity in the absence of a central umbrella organization
Smaller FMIPs administered by farmers market organizations bear the administrative burden both of running farmers markets as well as running a complex incentive program. This may occur in the absence of sufficient funding to cover the costs associated with effectively implementing an FMIP. Smaller programs with low organizational infrastructure, limited funding, or underdeveloped administrative capacity may find it difficult to absorb these costs and effectively run an FMIP in the absence of external administrative and fundraising support.
- Effectively dividing incentive funds among participating markets so as to ensure continuity of the incentive throughout the entire market season
The umbrella organization that administers the FMIP typically provides a lump sum of funding or incentive coupons to the market operators on an annual or monthly basis. However, it is often difficult to project the number of coupons that will be redeemed in a given year at a given market, and allocating coupons to each market in a way that is proportional to client need is a difficult task. Many programs use past coupon redemption levels plus predicted growth in client participation to project redemption levels at each market for the upcoming year. However, this method is fallible, and programs must often reallocate coupons mid-year in order to provide program continuity at markets that demonstrate high client need in a given year.
Funding
Survey participants responded to questions regarding funding sources. Table 2 lists a program funding summary.

Funding Best Practices
- Securing diverse, ongoing funding sources
FMIPs are supported by a variety of public and private funding sources. Nearly all of the programs surveyed receive funding from more than one source. Both public and private funders typically provide grants on an annual basis and require yearly reporting and reapplication for sustained funding. Most FMIPs maintain funding from the same source(s) for several consecutive years, although the level of funding from those sources often varies from year to year.
Funding can come from public sources, nonprofit or foundation sources, as well as from corporate or individual donations. A diverse funding base increases FMIP security and sustainability. Multiple funding streams help ensure that even if one source of funding fluctuates or ceases, organizations will be able to continue the program until alternative funding is secured. Diverse funding sources also in- crease the level of flexibility that organizations have in administering the FMIP. If one source of funding must be dedicated to a particular activity, alternative sources can be shifted towards general costs or other necessary activities. For example, some funders require that contributions be used specifically for the value of the incentive distributed to clients. Others require that grant monies go towards marketing and outreach only. With multiple sources of funding, markets can ensure that they have adequate funding for general staff costs, administration, as well as the cost of the incentive itself.
- Securing adequate administrative funding in addition to funding for the value of the incentive
Funders of existing FMIPs often stipulate that financial support be used specifically for the value of the incentive provided to nutrition assistance clients. This means that markets or umbrella organizations must absorb the extra costs of ad- ministering the FMIP into their existing, and often limited, budget. This places strain on the organization’s resources for other important activities and programs that contribute to the overall success of the market and FMIP.
The administrative costs of FMIPs are a significant portion of total program costs, especially early in the program operation. Upon start-up, administrative costs can comprise over 50% of the total costs of the FMIP. As the program grows and become established, administrative costs typically decrease as a portion of the total costs of the pro- gram. When reviewing and approving grant applications, it is important that funders be sensitive to the differences in the initial and ongoing needs of an organization operating an FMIP.
- Securing ongoing public funding from state and local entities
FMIPs with ongoing funding from municipal governments report the highest level of stability and predictability in funding support. FMIPs with local government funding also report an increased ability to leverage funds from private sources. Moreover, public funding is one venue through which programs might obtain crucial funding for overhead and administrative support.
Four of the surveyed programs receive public funding from local or state government entities. NYC Health Bucks is the only surveyed FMIP that is entirely publicly funded. In 2012, the NYC Health Resources Administration provided $350,000, DOHMH – in which the program is housed – granted $50,000, and the NYC Mayor’s office supported the program with $60,000 for program outreach efforts. The Mayor’s office also provides funding for one full-time administrative staff person for the program.
Hunger Action Los Angeles (HALA) administers an FMIP at twelve markets and receives a portion of its funding from the California Department of Food and Agriculture (CDFA) via a federal USDA Specialty Crop Block Grant award. HALA also receives funding through a contract with the Los Angeles County Department of Social Services.
The city governments in Boston and Seattle are ongoing sources of financial support for the FMIPs operating in those areas. The Boston Bounty Bucks FMIP, operated by BCFF, began in 2008 with strictly private funding. In 2011, the Boston Mayor’s office became a partner, providing $50,000 annually to support the FMIP.
- Maintaining accurate and updated revenue and customer data for grant requests and reports
Collecting and maintaining revenue and customer data throughout the length of the program is important for showing long-term impact and program success. Several of the surveyed FMIPs maintain robust and up-to-date data on program participation and incentive redemption rates, and a small handful of programs even perform additional program evaluations to assess impact on client fruit and vegetable consumption or on the economic benefits to market vendors, for example. Programs must find an appropriate balance between collecting data sufficient to showcase program success to funders and the public, while at the same time avoiding intrusive data collection practices directed towards clients who frequent the markets.
Funding Challenges
- Maintaining sufficient levels of funding to sup- port program maintenance and growth
The often limited amount and duration of funding can act as a barrier to program expansion. Limited financial resources, granted over short periods of time, prevent programs from consistently increasing the number of markets and/or clients served. Several of the smaller surveyed FMIPs report that program size and reach regularly fluctuate with the availability of funds in a given year.
- Reporting and reapplying for annual funding
The annual application and grant reporting process imposes significant administrative costs upon an organization, especially if that organization is small and has limited administrative or development capacity. Ongoing, multi-year grants, by comparison, reduce the administrative burden of annual data collection, reporting, and reapplication. Moreover, secure, ongoing funding allows new FMIPs to establish themselves and their customer base before beginning the evaluation process. Data collected after the FMIP has had time to work through initial obstacles and challenges will be more representative of the true impact of the program.
Technology
Survey participants responded to questions regarding technological capacity.
Technology Best Practices
- Providing training to all market managers on how to operate and troubleshoot EBT machines
In order to process SNAP and WIC benefits, farmers markets must acquire and maintain the proper EBT machines. SNAP and WIC require separate EBT machines and markets must contract with a third-party entity to process the electronic benefit redemptions.
Ensuring the smooth operation of EBT technologies is critical to the sustainability of an FMIP. Markets that repeatedly experience delays or disruption in EBT processing run the risk of losing their customers. They also risk alienating the vendors who participate in their markets. Seven of the surveyed FMIPs report that participating market staff and managers receive training on EBT operations. The training, in these cases, is provided by the organization running the market, by a larger farmers market association (such as the Farmers Market Federation of New York, in the case of NYC Health Bucks), or by the FMIP umbrella organization (such as the Boston Collaborative for Food and Fitness, in the case of Boston Bounty Bucks). One additional model for providing supplemental technical sup- port resources is the manual that three nonprofit organizations in Montana collaborated to produce for markets participating in the state’s Farmers Market EBT Pilot Project. It includes a checklist for market managers and information on the SNAP retailer authorization process, EBT machine set-up and operation, accounting procedures, and a variety of useful templates (National Center for Appropriate Technology et al.). Especially in cases where EBT machines are provided by a public entity (such as by the Texas Department of Agriculture, as was the case with some EBT machines previously used by Austin-based farmers markets) umbrella FMIP administrators might consider collaborating with city or state officials to provide the initial training and resources so that market staff can more effectively mitigate technical challenges.
- Ensuring that ongoing technical support is provided through the umbrella organization and/or service provider
Several surveyed FMIPs reported that a lack of adequate ongoing technical support from their contracted EBT service providers has historically posed challenges to effective program operation. To mitigate these problems, market managers and staff should have resources available to effectively address technical issues as they arise. Toward this end, the organization should consider contracting with a service provider that is not only willing but capable of providing technical assistance to farmers markets specifically. Many EBT service providers have never worked with nontraditional retailers before and are ill-equipped to address challenges that are unique to farmers markets (as reported by survey respondents), such as operating an EBT machine outdoors with variable internet connectivity. For example, Experimental Station recommends that Chicago LINK Up markets contract with Merchant Source to receive more effective, market- applicable support. The Boston Collaborative for Food and Fitness is also transitioning to Merchant Source for similar reasons. If a government agency is managing the contract (such as has historically been the case for many Austin markets), senior FMIP staff should consider communicating early with that agency about the importance of having access to dependable technical support.
Technology Challenges
- Covering the up-front costs of an EBT machine and service
Markets are often faced with paying up-front to acquire the EBT machine and contracting for the monthly processing service. The cost of both the equipment and service vary but, typically, the less the market pays for the EBT machine, the higher the costs of the processing service.
Markets are typically responsible for securing their own EBT machines, but some umbrella organizations have secured public or private grant funding that has covered the costs of EBT capacity. For example, a federal grant obtained by the Farmers Market Federation of New York paid for many of the EBT machines for participating markets in the NYC Health Bucks program. The Boston Bounty Bucks program received a grant from Wholesome Wave to purchase EBT machines in 2008. For markets that joined after 2008, the Kellogg Foundation purchased additional EBT machines. Additionally, BCFF received a USDA grant to cover the costs of monthly processing fees.
- Making technology solutions work for a wide variety of market locations and set-ups
The surveyed FMIPs report varying levels of technical difficulties in setting up and using the EBT machines and services at farmers markets. Problems included establishing a clear wireless signal for the EBT machine at the market, machines breaking down mid-season, and relying on service providers that are not accustomed to working with farmers markets. Two FMIPs report switching to EBT service providers that are more in tune with the specific needs of farmers markets and better able to help market staff troubleshoot specific technological and customer service issues. These types of technological challenges associated with acquiring and running EBT equipment are mirrored in the results of a recent USDA farmers market operations study that includes data from 1,682 farmers markets nationwide (Dixit-Joshi et al. 93-100). Experimental Station, the nonprofit that administers the Chicago FMIP, recommends that farmers contract with Merchant Source, an EBT processing company that also provides EBT machines and technical support to farmers markets as an all-in-one package.
- Ensuring that markets have access to technical support during market hours
Farmers markets may have unique hours of operation and it is important that market staff have access to support from the service provider, umbrella organization, or public agency contact during these times. Towards this end, markets might consider designating a market staff member who has additional training in or experience operating EBT machines. This individual would be responsible for resolving EBT issues as much as he or she is capable and triaging more complicated issues that arise. He or she would elevate service requests to the appropriate contact (whether a public staff person, EBT machine/service provider, or other) as necessary.
Participation
Survey participants responded to questions regarding vendors, customers, and client eligibility.
Participation Best Practices
- Allowing customers who are not SNAP recipients, but can prove income-eligibility for SNAP, to participate in the FMIP
All surveyed FMIPs cite low-income populations as the demographic they hope to reach. Four of the 10 programs surveyed only accept SNAP benefits as matching funds toward the incentive. Two of the markets, however, accept cash from clients who are income-eligible but do not receive SNAP benefits. For example, in California, Supplemental Security Income (SSI) recipients are not eligible to receive SNAP benefits and the vast majority of California farmers markets are not authorized to accept WIC benefits. However, if a customer can provide proof of receiving SSI or WIC, he or she is eligible to receive the incentive. Nevertheless, since the market is unable to process SSI or WIC, the client provides cash to receive the incentive match.
- Tailoring market size and location to the needs of the neighborhood and community
Farmers markets that offer the FMIP are strategically located in neighborhoods with underserved populations. The markets are often established in highly visible, easily accessible locations such as in church parking lots, outside of community clinics, and in local parks.
Markets offering an FMIP vary greatly in the number of vendors and customers that participate. Markets and FMIPs operate at the size that is suitable to the number of customers that patronize the market. Therefore markets with lower customer participation have fewer vendors and distribute fewer incentives. This does not indicate a less successful FMIP, but illustrates that markets and FMIPs must be tailored to the specific needs of the community or neighborhood served. Regard- less of size, markets and farmers participating in the FMIPs typically realize increased sales and revenues during each successive year of program participation.
Markets with anywhere from 1 to 80 vendors are capable of operating a successful FMIP. However, an umbrella organization that administers the FMIP for a large number of markets is often better able to support the very small and very large markets. Most markets participating in the surveyed FMIPs range from 10 to 20 vendors.
- Allowing community-based organizations that serve low-income or at-risk populations to refer clients to the FMIP
NYC Health Bucks provides incentive coupons to clients of local community organizations that partner with DOHMH to distribute coupons. The $2 coupon is distributed through community organizations and is decoupled from nutrition assistance benefits or other match contributions, meaning that a customer can spend the $2 coupon at any participating market location without providing a match. The East Palo Alto Fresh Checks program accepts SNAP and cash as matching funds for the $20 incentive. However, low-income customers who are referred from a community-based organization, or show proof of WIC or SSI receipt, are also eligible to receive the incentive. These customers can provide up to $20 cash in order to receive an equal amount in incentive tokens.
Participation Challenges
- Retaining vendors at smaller markets that have lower revenues and customer patronage
Smaller markets, such as the East Palo Alto market, report difficulty attracting and retaining culturally appropriate vendors at their markets due to relatively low customer participation and total revenue.
- Ensuring that limited market hours do not pose a barrier to participation for some consumers
Some program staff members report that weekly markets, with limited and specific hours of operation, are inconvenient for many clients who may not be able to attend due to work or family obligations.
- Dispelling perceptions that farmers market products are too expensive or take too long to prepare
A number of surveyed FMIPS report that many potential program clients perceive the available products to be expensive and time-consuming, deterring program participation.
Outreach
Survey participants responded to questions regarding outreach strategies.
Outreach Best Practices
- Tailoring outreach to specific populations and geographic areas
Strategic outreach efforts are an essential component of any FMIP. Outreach strategies used by the surveyed programs ranged from distributing brochures, to hosting or attending community meetings, to advertising through traditional media sources. Although umbrella organizations provide some outreach support for all of participating markets, most individual markets also do targeted outreach to specific communities that they serve. In conducting outreach, markets are careful to tailor their message to the specific demographic groups they hope to serve with the FMIP. Marketing and outreach materials are produced in various languages and placed in community organizations and spaces that serve a similar demographic.
For example, Michigan farmers markets publish outreach materials in Russian, Mandarin, and Spanish. They strategically place materials in schools, food pantries, health clinics, and local businesses. Additionally, the Michigan DUFB FMIP umbrella organization, the Fair Food Network, does statewide outreach including billboard and radio advertising.
Some market organizations do mailings to low- income zip codes with the specific language and information relevant to the majority population of that area. In Boston, BCFF handles the outreach efforts for all participating Boston markets. BCFF requires their markets to fill out an order form, indicating what amount of materials they need for outreach, including banners, posters, shopping bags, and laminated documents.
- Developing partnerships with governmental and non-governmental agencies to assist in outreach efforts
Some FMIPs partner with state and local agencies that administer nutrition assistance programs to help with outreach for the FMIP. BCFF, for example, partners with the Department of Transitional Assistance, Boston Public Schools, local housing authorities, and other community-based organizations to assist with program outreach and promotion.
Outreach Challenges
- Getting word out about both the market and FMIP to a broader audience than the traditional market customers
Effectively reaching potential program clients who do not traditionally frequent the market can be a challenging task for FMIPs.
- Ensuring that the market is welcoming and culturally appropriate for all prospective customers
At market locations, it is important to provide accommodations for a variety of populations including seniors, families with young children, non- English speakers, and individuals with disabilities. Markets can do so by having bilingual volunteers and staff, culturally appropriate activities and services, highly accessible locations, and signage and information in multiple languages.
- Absorbing the cost of targeted outreach – this can become a limiting factor for many markets and organizations, especially those without an umbrella organization
If an organization does not have sufficient funding or administrative capacity to launch a robust outreach program, absorbing the costs of this outreach can be very burdensome. Outreach, however, is a critical component of program success and programs that fail to do appropriate outreach may see a more limited program impact.
Evaluation
Survey participants responded to questions regarding data tracking and program evaluation strategies.
Evaluation Best Practices
- Identifying the most useful metrics for evaluation and collecting thorough data on an annual or semi- annual basis
All surveyed FMIPs track total incentive redemption annually, and many track customer participation. Most of this data is collected at the market level and aggregated by the umbrella organization. Umbrella organizations often require reports with varying levels of frequency and detail. Very few markets or umbrella organizations are collecting data on behavior change or health outcomes of program participants.
Some umbrella organizations, including funding entities, have successfully conducted more comprehensive evaluations. For example, FFN evaluates its FMIP on an annual basis and collects data from market operators, participating vendors, and incentive recipients. It uses this data to determine the effect that DUFB has on promoting healthier food choices and to measure the impact on the local food economy (Fair Food Network). FFN also uses the data to identify best practices among markets in implementing the FMIP. They use those best practices for improving and replicating the model.
Several FMIP administrators report that they would like to collect more data on customer participation and shopping patterns. Portland Farmers Market Fresh Exchange program staff report the need to develop a simple way to determine if a SNAP customer is a first-time or repeat shopper. The Boston Bounty Bucks program staff report that it would be helpful to know what percentage of total vendor sales was attributable to SNAP customers. Surveying vendors regarding their perception of the FMIP and impact on sales, as well as gathering qualitative data from markets to determine best practices and challenges, are additional areas in which data collection may be useful.
- Making customer surveys and interviews optional for participants, if possible
Markets report that collecting data through surveys or interviews with FMIP customers is often cumbersome and even a deterrent to participation. For example, the East Palo Alto Fresh Checks program reports that it is required by a funder to collect monthly survey data on purchasing patterns and eating behaviors. Market staff cites the eight- question survey as too lengthy and time-consuming for both the organization and customers. The Chicago LINK Up FMIP reports they have learned not to ask participants too many questions.
Evaluation Challenges
- Complying with grant requirements for evaluation without overwhelming customers with survey questions and other evaluation
Offering customers an incentive to participate in the survey may be one way to collect data for program evaluation and grant reporting purposes without overwhelming customers.

Outcomes
Markets that participated in an FMIP for two or more years experienced significant increases in customer participation and incentive redemption. As participation grows, some markets experience difficulty stretching the incentive funds to meet increased demand from customers.
For example, Los Angeles Market Match and NYC Health Bucks are often forced to ration or reduce the amount of incentive funding distributed to markets at the end of the market season or fiscal year. Programs and markets that track EBT spending and incentive redemption across years have documented significant increases in both incentive redemption and SNAP redemption per participating market from year to year (see Tables 4, 5, and 6).


On the whole, vendors report financial benefit from their participation in the FMIP. A study by Wholesome Wave found that the majority of vendors (66%) at markets with an FMIP reported increased sales. Vendors also reported expanding operations, diversifying products, adding acre- age, and hiring additional staff as a result of the increased revenues from the FMIP (Wholesome Wave). FFN in Michigan reports data on average SNAP sales per market and per farmer participating in DUFB (see Table 4). Average SNAP EBT redemption per participating farmer increased from $327 in 2009 to $1427 in 2012.
The percentage of total customers that participate in the FMIP at a given market ranges from 5% to 80%. Some umbrella organizations administering an FMIP do not collect detailed data on total number of customers (see Table 3 for market and FMIP customer count data.) All surveyed markets saw an increase in SNAP or WIC clients visiting their markets after offering the FMIP. For example, from 2011 to 2012, Chicago farmers markets saw the number of SNAP customers jump from 5,400 to 10,666.
Established markets that only later added an FMIP saw levels of SNAP and WIC redemption rise significantly after program implementation. Also, if funding has allowed for it, most markets have disbursed an increasing level of incentive benefits each year since launching the program. Some FMIPs have experienced increased demand for incentive benefits at their markets, but have not been able to maintain sufficient funding to support that demand. For example, in the Portland Fresh Exchange program, a dip in funding led to a reduction in incentive spending from $26,000 in 2009 to just $9,000 in 2010. The Portland Farmers Market organization proceeded to establish a sister nonprofit to handle fundraising and subsequently was able to increase its incentive redemption to $34,000 in 2012.
Conclusion: Making the Case for FMIPs
FMIPs are helping to significantly increase the frequency with which low-income customers shop at farmers markets. FMIPs are also increasing the economic stability and sustainability of the markets and vendors that accept the incentive. On a per market and per farmer basis, SNAP redemption, incentive redemption, and SNAP customer visits increased annually for the programs that reported data for those indicators.
Based on the information shared by programs included in the survey, FMIPs have great potential to positively affect the nutritional status and food security of low-income consumers as well as the revenue of local farmers and farmers markets. Investing in FMIPs is one way to leverage federal food security funding (through SNAP, WIC, and FMNP dollars) to help increase financial access to healthy food and channel dollars into the local food economy. FMIPs are one food policy tool that enables policymakers and community leaders to bridge the gap between food security and local food, as well as promote community and economic development more broadly. An analysis of best practices at 10 FMIPs nationwide reveals that continuity in funding, strategic evaluation practices, tailored outreach efforts, and administrative and technical support through a central umbrella organization are all critical components of programmatic success. Moreover, those FMIPs which have received strong and ongoing public funding support, in particular, have identified this support as a key enabler of FMIP sustainability and success. Public entities, through funding as well as ongoing administrative and technical support, have a potentially powerful role to play in increasing the spread and impact of FMIPs across the country. Local policymakers and practitioners should consider the experiences and best practices of the surveyed FMIPs as a guide and tool in launching or scaling up programming in their own communities, with the goal of applying the broader experiences and lessons of other pro- grams to the place-specific challenges and needs each community will face as it seeks to build a more sustainable and accessible local food system.
Notes
- For a review of the primary tenets of the traditional anti- hunger and food security movement, see Chapter 2 of Patricia Allen’s Together at the Table, “Perspectives of Alternative Agrifood Movements: Issues and Concepts.” Additionally, Feeding America is one of the nation’s leading hunger-relief charities, and its mission and programming efforts may serve as an example of some of the types of hunger-relief work being done in the United States. See website for details.
- The local food movement is closely related to, and often considered synonymous with, terms such as “locavore,” “Slow Food,” or “farm-to-table.” Michael Pollan is one well-known food journalist who advocates for a local diet. See his take on the benefits of local food in the PBS documentary and educational initiative Nourish. Additionally, Local Harvest is an online directory of local food producers that outlines several of the perceived benefits of local food on its web page, “Why Buy Local.”
- See White; Alkon, Black, White, and Green: Farmers Markets, Race, and the Green Economy; Guthman; and Balasubra- manian.
- For existing data on FMIPs, including their public health and economic impacts, see Johns Hopkins Center for a Livable Future, Dixit-Joshi et al., Fair Food Network, and the New York City Department of Health and Mental Hygiene.
- See Jones; Blanke and Burdick; and Pirog.
- For an elaboration on local food as a social movement see Starr; see Delind for thoughts on the relationship between local food, place, and culture.
Works Cited
Adams, Elizabeth J. et al. “Food Security is Associated with Increased Risk of Obesity in California Women.” Journal of Nutrition 133.4 (2003): 1070.
Alkon, Alison Hope. Black, White, and Green: Farmers Markets, Race, and the Green Economy. Athens: University of Georgia Press, 2012.
Alkon, Alison Hope. “Paradise or Pavement: The Social Constructions of the Environment in Two Urban Farmers’ Markets and Their Implications for Environmental Justice and Sustainability.” Local Environment 13(2008): 271-289.
Allen, Patricia. Together at the Table: Sustainability and Sustenance in the American Agrifood System. University Park: The Pennsylvania State University Press, 2004.
Balasubramanian, Janani. “Sustainable Food and Privilege: Why Is Green Always White (and Male and Upper Class).” May 10, 2010. Racialicious. Accessed May 7, 2013. http://www.racialicious.com/2010/05/20/sustainable-food-and-privilege-why-is-green-always-white-and-male-and-upper-class/
Bardach, Eugene. A Practical Guide for Policy Analysis: The Eight- fold Path to More Effective Problem-Solving. Thousand Oaks: CQ Press, 2012.
Blanke, M.M. and B. Burdick. “Food (Miles) for Thought.” Environmental Science and Pollution Research. 12(2005). 125-127.
Briggs, Suzanne et al. Real Food, Real Choice: Connecting SNAP Recipients with Farmers Markets. Community Food Security Coalition and Farmers Market Coalition. 2010. http://www.foodsecurity.org/pub/RealFoodRealChoice_SNAP_FarmersMarkets.pdf
Cawley, John. “The Economics of Childhood Obesity.” Health Affairs 29.3 (2010): 364-371.
Center on Budget and Policy Priorities. “Policy Basics: Introduction to the Supplemental Nutrition Assistance Program (SNAP).” CBPP website. Accessed May 6, 2013. http://www.cbpp.org/cms/index.cfm?fa=view&id=2226
Congressional Research Service. The Role of Local Food Systems in U.S. Farm Policy, by Renee Johnson, Tadlock Cowan, and Randy Alison Aussenberg. 2012. http://www.ams.usda.gov/AMSv1.0/getfile?dDocName=STELPRDC5097249
Delind, Laura B. “Of Bodies, Place, and Culture: Re-situating Local Food.” Journal of Agricultural and Environmental Ethics 19(2006):121 – 146.
Fair Food Network. Double Up Food Bucks 2012 Evaluation Re- port. 2013. http://www.fairfoodnetwork.org/sites/default/files/FFN_DUFB_Evaluation_2012_sm_0.pdf
Feeding America. “Feeding America: Hunger-Relief Charity | FeedingAmerica.org.” Accessed May 2, 2013. http://feedingamerica.org/
Guthman, Julie. “The Unbearable Whiteness of Alternative Food.” Audio Recording. Accessed May 5, 2013. http://www.havenscenter.org/audio/julie_guthman_incredible_whiteness_alternative_food
Johns Hopkins Center for a Livable Future. Improving Diets of Low-Income American Through SNAP Pricing Incentives. 2012. http://www.jhsph.edu/research/centers-and-institutes/johns-hopkins-center-for-a-livable-future/_pdf/projects/ffp/farm_bill/SNAP-Pricing-Incentives.pdf
Jones, A. “An Environmental Assessment of Food Supply Chains: A Case Study on Dessert Apples.” Environmental Management. 30 (2002): 560-576.
Local Harvest. “Why Buy Local.” Accessed May 5, 2013. http://www.localharvest.org/buylocal.jsp
Mercier, Stephanie. Review of U.S. Nutrition Assistance Policy: Programs and Issues. AGree. 2012. http://www.foodandagpolicy.org/sites/default/files/AGree%20Review%20of%20US%20Nutrition%20Assistance%20Policy_1.pdf
Morse, Lisa et al. Farmers’ Market Survey & Price Comparison Study. Southwestern University. 2012. Accessed May 7, 2013. http://www.southwestern.edu/live/files/2161-capstone2012results
National Center for Appropriate Technology et al. Montana Farmers Market Electronic Benefits Transfer Manual: How to Accept SNAP Benefits at Your Farmers Market. 2012.
New York City Department of Health and Mental Hygiene. New York City Health Department Farmers’ Market Programs. 2012. http://www.nyc.gov/html/doh/downloads/pdf/cdp/farmers-market-report-11.pdf
Nourish. “Michael Pollan, ‘Why Eat Local?’ | Nourish: Food + Community.” Public Broadcasting Service. Accessed May 7, 2013. http://www.nourishlife.org/2011/03/why-eat-local/
Parker-Pope, Tara. “A High Price for Healthy Food.” The New York Times 5 December 2007. http://well.blogs.nytimes.com/2007/12/05/a-high-price-for-healthy-food/
Pelletier, Jennifer E. et al. “Positive Attitudes toward Organic, Local, Sustainable Foods Are Associated with Higher Dietary Quality among Young Adults.” Journal of the Academy of Nutrition and Dietetics 113(2013): 127–132.
Pirog, Rich. Food, Fuel, and Freeways: An Iowa Perspective on How Far Food Travels, Fuel Usage, and Greenhouse Gas Emissions. Leopold Center for Sustainable Agriculture. 2002. http://www.leopold.iastate.edu/sites/default/files/pubs-and-papers/2011-06-food-fuel-and-freeways-iowa-perspective-how-far-food-travels-fuel-usage-and-greenhouse-gas-emissions.pdf
Pollan, Michael. “The Food Movement, Rising.” The New York Review of Books 10 June 2010. Accessed May 2, 2013. http://www.nybooks.com/articles/archives/2010/jun/10/food-movement-rising/?pagination=false
Ratcliffe, Caroline and Signe-Mary McKernan. How Much Does SNAP Reduce Food Insecurity? The Urban Institute. 2010. http://www.urban.org/UploadedPDF/412065_reduce_food_insecurity.pdf
Seligman, Hilary K. et al. “Food Insecurity Is Associated with Chronic Disease among Low-Income NHANES Partici- pants.” Journal of Nutrition 140.2 (2010): 304 – 310. http://www.ncbi.nlm.nih.gov/pmc/articles/PMC2806885/
Starr, Amory. “Local Food: A Social Movement?” Cultural Stud- ies, Critical Methodologies 10(2010): 479–490.
TXP, Inc. The Economic Impact of Austin’s Food Sector, for the City of Austin. 2013. http://www.austintexas.gov/sites/default/files/files/Redevelopment/Economic_Development/TXP_Austin_Food_Sector_Report_03282013_FINALv1.pdf
United Kingdom Department for Environment, Food and Rural Affairs. The Validity of Food Miles as an Indicator of Sustain- able Development, by Alison Smith, et al. 2005. http://archive.defra.gov.uk/evidence/economics/foodfarm/reports/documents/foodmile.pdf
USDA. “Supplemental Nutrition Assistance Program: Healthy Incentives Pilot Program.” Accessed October 30, 2013. http://www.fns.usda.gov/snap/hip/
USDA, Agricultural Marketing Services. Farmers Markets and Local Food Marketing. Accessed May 8, 2013. http://www.ams.usda.gov/AMSv1.0/ams.fetchTemplateData.do?template=TemplateS&leftNav=WholesaleandFarmersMarkets&page=WFMFarmersMarketGrowth&description=Farmers%20Market%20Growth
USDA, Economic Research Service. Does SNAP Decrease Food Insecurity? Untangling the Self-Selection Effect, by Mark Nord and Anne Marie Golla. 2009. Report Number 85. http://www.ers.usda.gov/media/184824/err85_1_.pdf
USDA, Economic Research Service. “Food Security in the U.S.” Accessed May 5, 2013. http://www.ers.usda.gov/topics/food-nutrition-assistance/food-security-in-the-us.aspx#.UXw48soQWSq
USDA, Economic Research Service. Household Food Security in the United States in 2011, by Alisha Coleman-Jensen et al. 2012. Report Number 141. http://www.ers.usda.gov/media/884525/err141.pdf
USDA, Economic Research Service. The Food Assistance National Input-Output Multiplier (FANIOM) Model and Stimulus Effects of SNAP, by Kenneth Hanson. 2010. Economic Research Report Number 103. http://www.ers.usda.gov/media/134117/err103_1_.pdf
USDA, Economic Research Service. Local Food Systems: Concepts, Impacts, and Issues, by Steve Martinez, et al. 2010. Economic Research Report Number 97. http://www.ers.usda.gov/media/122868/err97_1_.pdf
USDA, Food and Nutrition Service. National Survey of Farmers Market Managers and Direct Marketing Farmers. April 2013. http://www.fns.usda.gov/ora/MENU/Published/snap/FILES/ProgramOperations/FarmersMarketsOps.pdf
USDA, Food and Nutrition Service. Nutrition Assistance in Farmers Markets: Understanding Current Operations, by Sujata Dixit-Joshi et al. 2013. http://www.fns.usda.gov/Ora/menu/Published/SNAP/FILES/ProgramOperations/FarmersMarketsOps.pdf
Veselý, Arnošt. “Theory and Methodology of Best Practice Research: A Critical Review of the Current State.” Central European Journal of Public Policy. 5(2011): 98 – 117.
Weber, Christopher L. and H. Scott Matthews. “Food Miles and the Relative Climate Impacts of Food Choices in the United States.” Environmental Science and Technology 42(2008): 3508–3513.
White, Audrey. “Nutrition Benefits a Mixed Bag for Farmers Markets.” The Texas Tribune 28 March 2013. Accessed May 5, 2013. http://www.texastribune.org/2013/03/28/farmers-markets-face-challenges-taking-benefits/
Wholesome Wave. Healthy Food Access Cluster Evaluation. 2011. Accessed October 30, 2013. http://www.healthyfoodincentives.org/_site/_downloads/cluster-evaluation-2011-final-report.pdf
Wholesome Wave. Wholesome Wave’s Double Value Coupon Program: Increasing Food Access and Local Farm Business Nationwide, 2009-2012 Outcomes and Trends. 2012. Accessed May 11, 2013. http://wholesomewave.org/wp-content/uploads/2012/01/041213-WW-DVCPExecSumsmallpdf-1. pdf
WhyHunger. “Introduction: Food Sovereignty.” Accessed May 8, 2013. http://www.whyhunger.org/getinfo/showArticle/articleId/3081
Wilde, Parke. Food Policy in the United States. New York: Routledge, 2013.
Biographies
The following authors produced their research together in the spring of 2013 as part of an independently designed food policy course at the Lyndon B. Johnson School of Public Affairs at the University of Texas, Austin.
Amy Madore graduated with a Master of Public Affairs in May of 2013, and currently works as a Planner with the Travis County Criminal Justice Planning Department in Austin, Texas.
Jeanie Donovan continues to pursue a dual master’s degree in public health and public affairs while working in state-level nutrition policy at the Austin-based Center for Public Policy Priorities.
Megan Randall is pursuing a dual master’s degree in community planning and public affairs while working in state-level health care policy at Center for Public Policy Priorities.
Kate Vickery is also pursuing a dual master’s degree in community planning and public affairs and works as an Urban Agriculture Planner for the Sustainable Urban Agriculture & Community Garden program at the City of Austin.
